[Survey Report] "Nested Consumption" is at it again! // When the heat is on... More than 20% of respondents said that when it gets extremely hot... "Watching streaming video online" and "Online shopping" will increase. More than 20% of respondents said they would increase their "online shopping" and "watching streamed videos online" when the weather gets hotter.
Reading Market Changes Due to Climate Change Results of "Survey on the Impact of Extreme Heat on Behavior, Consumption, etc.
LifeTimeTechLabo Inc.
The annual average temperature in Japan for the year 2023 was the highest since statistics began, and the forecast for the summer of 2024 was announced last week.
(Head office: Nagoya City, Aichi Prefecture; Representative: Yoji Usami), a company that provides support for corporate marketing strategy planning and implementation, took this opportunity to conduct a survey on the effects of "extreme heat" on consumer behavior, consumption, and consumption patterns in order to foresee the impact of climate change on the consumption market in the future. (Head Office: Nagoya, Aichi, Japan; President: Yoji Usami) conducted an Internet survey to find out how the "extreme heat" would affect consumers' behavior, consumption, and interests. We conducted an Internet survey to ask about their awareness of this issue.
Summary of Survey Results
Nearly half (44.5%) of the respondents answered that their behavior would "change (increase or decrease)" due to the "extreme heat," while more than one-third answered that it would "change (increase or decrease)" in "frequency of going out," "time at home," "exercise/sports," and "going out with friends/acquaintances.
More than 30% of respondents answered that their "Time at home" will "Increase," while "Watching streamed videos" and "Internet shopping" also exceeded 20%. On the other hand, "frequency of going out" was selected by more than 35% of respondents as decreasing, followed by "exercise/sports" and "going out with friends/acquaintances" at more than 25%.
In terms of consumption, more than half (55.4%) of respondents answered that their consumption will "change (increase or decrease)" in "Utility expenses," followed by more than 30% in "Food and beverage expenses.
Utility expenses" was selected by a large majority of respondents (55.4%), followed by "Food and beverage expenses" at more than 30%. On the other hand, "Decrease" was the most common response for "Entertainment" and "Transportation.
In the question asking about the impact on interest, more respondents chose "will increase" than "will decrease" for all items. [The global environment was selected by more than 35% of the respondents as an area of concern, followed by family, the Japanese economy and society, and themselves, in that order.
Detailed results of the survey (excerpts)
The survey asked 1,000 men and women between the ages of 20 and 69 how they think their behavior, consumption, and interests will change this summer if it is as hot or hotter than last year in 2023. The first question asked how they thought their behavior, consumption, and interests would change if this summer were to be as hot or hotter than last year in 2023.
The first question asked about changes in behavior (time), and asked respondents to select one item for each category from the following options: "will increase," "will increase," "will remain the same," "will decrease," or "will decrease significantly.
The first graph shows the items in order of the percentage of "no change" responses.
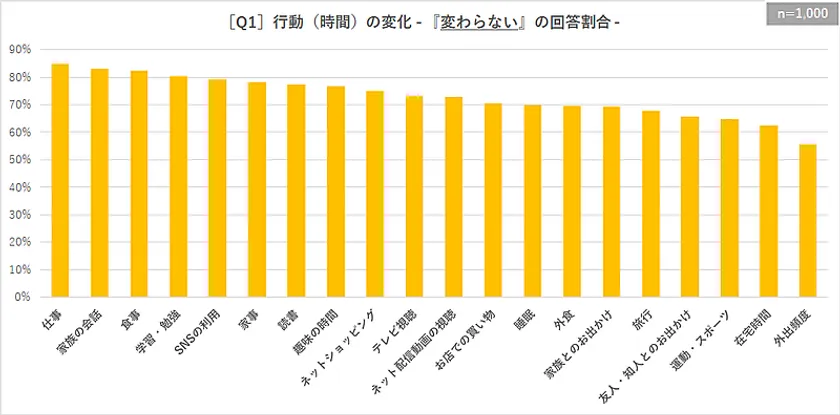
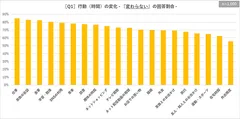
[Q1] Change in behavior (time) - Percentage of "No change" responses
[The percentage of "No change" was high for "Work (84.7%)," "Family conversation (83.0%)," and "Meals (82.4%)," and more than 80% for the four items up to "Study/Study.
On the other hand, the percentage of "change" (= total percentage of "increase, increase, decrease, or decrease significantly")* was high in "frequency of going out (44.5%)," "time at home (37.6%)," and "exercise/sports (35.1%)," in order from right to left, and was over 30% in 8 categories up to "sleep.
* [Change] Percentage values are the inverse of the bar graph. The definition is the same for the second and fourth questions
The next two graphs show the percentages of the total responses for each of "Increase significantly" and "Decrease significantly," sorted from highest to lowest.
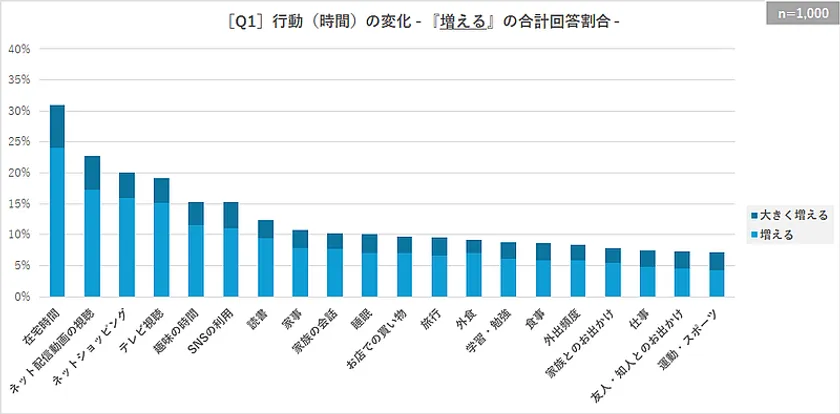
[Q1] Change in behavior (time) - Percentage of "increase" responses
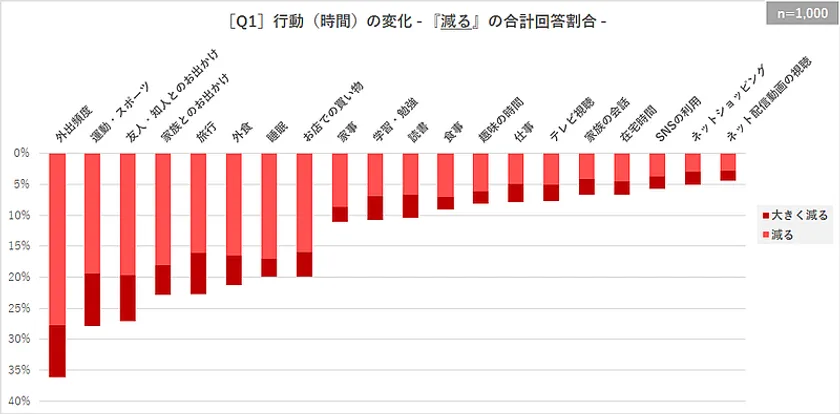
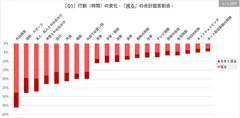
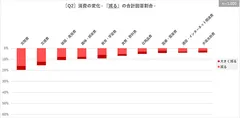
[Q1] Change in behavior (time) - Percentage of "Decrease" responses - Percentage of "Increase
[The highest percentage of "Increase" was for "Time spent at home (31.0%)," followed by "Watching streamed videos online (22.7%)," "Online shopping (20.1%)," and "Watching TV (19.1%).
On the other hand, "frequency of going out (36.1%)" received the highest percentage of "decrease," followed by "exercise/sports (27.9%)" and "going out with friends/acquaintances (27.1%).
The results of this question on changes in behavior (time) indicate that...
The results of this question on changes in behavior (time) suggest that the "heat wave" is a factor that causes major changes in lifestyle as well as the "Corona Disaster.
In other words, while so-called "nest egg consumption," centered on online consumption, will flourish again as people spend more time at home, the decline in frequency of going out is expected to lead to a decline in demand for out-of-home products such as retail businesses, eating out, and travel-related products.
Last year, 2023, was also a hot year, but the "reopening demand" that followed the Corona disaster is thought to have greatly boosted demand in the outing (travel)-related market, so there is concern that the summer after 2024 will once again return to a harsh environment after that demand pauses.
(It is a relief, however, that unlike the corona excess, this is expected to be a seasonal decline in demand.)
In light of the above, these outing (travel)-related industries will probably become more dependent on "inbound consumption" and the like if the hot summer continues in the future.
The next question targets changes in consumption, with examples of 10 spending items, and asks respondents to choose one from the same options as the previous question for each item.
For each item, respondents were asked to select one item from the same options as in the previous question.

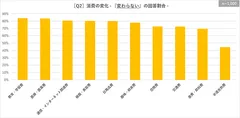
[Q2] Changes in Consumption - Percentage of "No Change" Responses
[In order from highest to lowest, "Education/Learning (84.0%)," "Medical/Medical (83.5%)," "Communication/Internet (80.6%)," and so on, with half of the items up to "Daily Necessities" accounting for 80% or more of the responses.
Conversely, the percentages for "change" were, in order from right to left: "Utilities (55.4%)," "Food and beverage (30.6%)," "Transportation (27.7%)," "Entertainment (27.4%)," and so on.
The next two graphs similarly show the total percentages of "increase" and "decrease," respectively, sorted from highest to lowest.
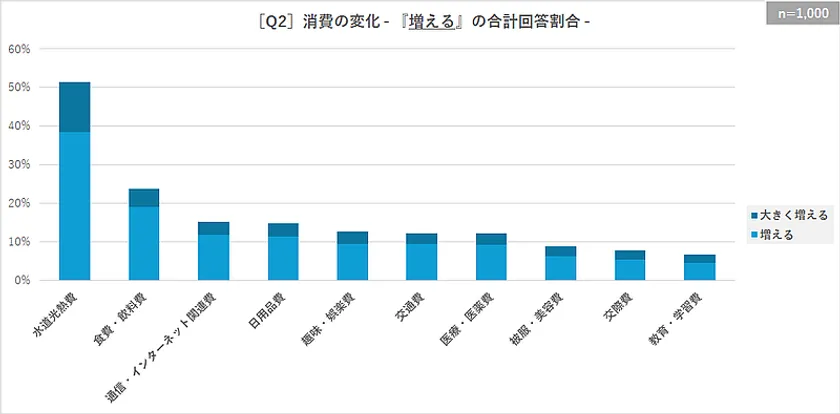
[Q2] Change in Consumption - Percentage of "Increase" Respondents
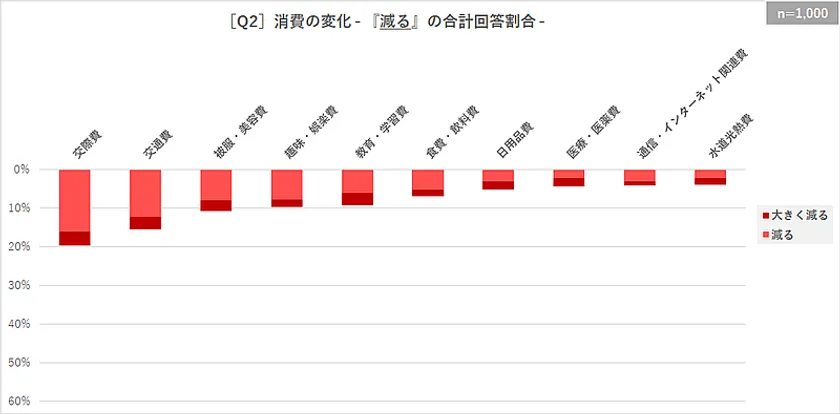
[Q2] Change in Consumption - Percentage of "Decrease
[The "Increase" response rate was more than twice as high for "Utilities (51.4%)" as for "Food and beverages (23.7%)," followed by "Communication and Internet-related expenses (15.2%)" and others.
[The percentage of respondents who said their spending "will decrease" was relatively high for "Entertainment (19.6%)," "Transportation (15.5%)," and "Clothing and beauty (10.8%)," while the percentage of respondents who said their spending "will decrease" was less than 10% for "Hobbies and entertainment" and the following items.
The results of this question show that...
Although the overall impact on consumption was perceived to be less than that on behavior (time), some items, such as "utilities" and "food and beverage expenses," showed strong concern among sei-katsu-sha about the increase in these expenses.
Food and beverage" and "utilities" are essential spending items and have already hit households hard due to price hikes caused by the weak yen, high prices, and reductions (or termination) of subsidies.
Therefore, if the "heat wave" continues this year and this concern becomes true, it will be a double punch that will put pressure on household finances and may become a major factor in restraining other consumption activities.
With real wages remaining negative, combined with a heightened awareness of the need to protect one's livelihood, this may be one of the major factors holding back Japan's economy from entering a virtuous cycle.
*** ***
The last question targets changes in interest, with nine example items, and asks respondents to select one item from [very high / high / no change / low / very low] for each item.
The graphs are arranged in the same order as for the first two questions, starting with the item with the highest percentage of "no change" responses.
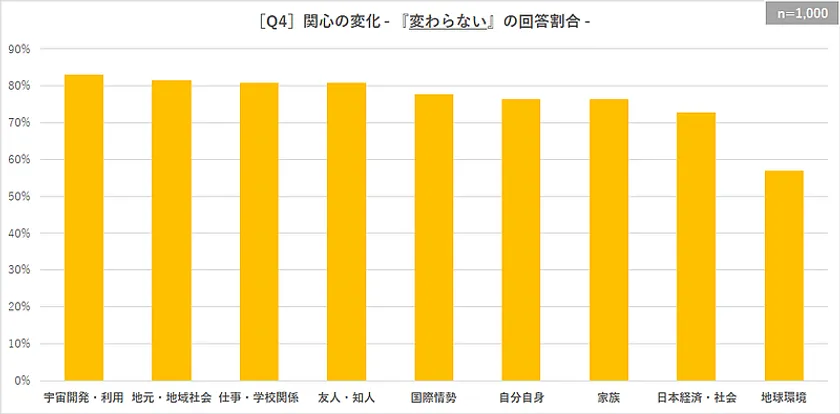
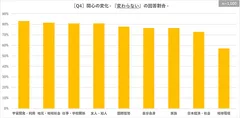
[Q4] Change in interest - Percentage of "No change" responses
[The "unchanged" response rates were high for "Space development/utilization (83.1%)," "Local/regional community (81.4%)," "Work/school (80.9%)," and "Friends/acquaintances (80.8%)," all of which exceeded 80% of the responses.
On the other hand, "Global environment (43.0%)" on the rightmost side of the graph had the highest percentage of "Change," followed by "Japanese economy and society (27.2%)" and others.
The next two graphs similarly show the total percentages in the "increasing" and "decreasing" directions, in descending order from highest to lowest.
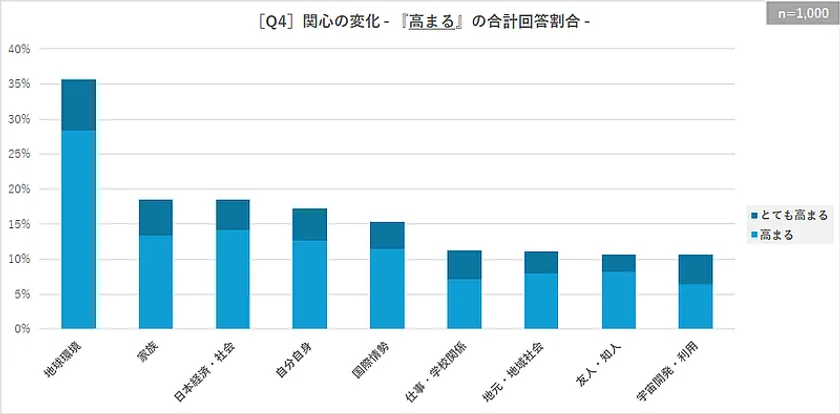
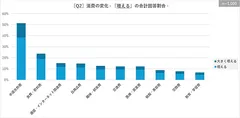
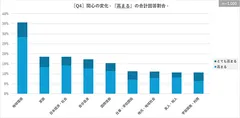
[Q4] Change in Interest - Percentage of "Increasing" Responses

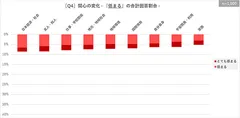
[Q4] Change in interest - Percentage of "Decrease" responses
[The percentage of respondents who selected "Increasing" was particularly high for "Global environment (35.7%)," followed by "Family (18.5%)" and "Japanese economy and society (18.5%)," which was nearly twice as high as that of "Family" and "Japanese economy and society.
The opposite was true for "Decrease" in "Japanese economy and society (8.7%)" and "Friends and acquaintances (8.5%)," but the percentages were less than 10% in each of these categories.
Furthermore, the percentage of respondents who answered "more likely" minus "less likely" was positive for all items.
The last question shows that...
As expected, there was not much change in interest in items other than "global environment," but the fact that all items worked in the direction of increasing interest was, in a sense, surprising.
The fact that climate change, such as a "heat wave," can trigger increased interest not only in global environmental issues, but also in familiar themes, such as one's own family, may lead to the creation of new business opportunities to solve various social issues in the future. The event may also serve as an opportunity to create new business opportunities to solve social issues in the future.
*** ***
Please refer to our website for the full text of this survey report.
Survey Summary
Survey on the Impact of the Heat wave on Behavior, Consumption, etc.
Survey method: Internet survey
Survey period: May 23-24, 2024
Survey population: 20-69 year olds nationwide
(Using "Freeasy Affiliated Panel" by I-Bridge Corporation)
Number of valid responses: 1,000 samples (equally distributed by sex and age)
Number of questions: 4
Company Profile
Company Name : LifeTimeTechLabo LLC
Location: 1-11-12 Meieki Minami, Nakamura-ku, Nagoya, Aichi 450-0003, Japan
Business Outline : Planning and operation of internet and application services
Support and consultation for marketing strategy and service development
Website : https://lttl.jp/
Official Instagram : https://www.instagram.com/lifetimetechlabo/
Image

Logo Image
- Category:
- Research & Reports